
To read OBD2 live data, first identify the parameter, its units and the engine's operating state. Then compare related readings under a defined condition. A number that looks unusual is a lead for testing, not an automatic diagnosis of the sensor whose name appears beside it.
Start with one question: why the engine runs rough at idle, whether a temperature reading is plausible, or what changes when a symptom occurs. Opening every available gauge at once usually makes the evidence harder to interpret.
This guide explains a repeatable reading method rather than a universal chart of “normal” values. Specifications depend on the vehicle, the parameter definition and the condition being tested.
Credit: www.youtube.com
Confirm the scanner can show the data you need
A tool that reads generic engine codes may not show every manufacturer-specific parameter or another module's data. Check coverage for your exact vehicle and the function you need before concluding that a missing value indicates a failed sensor.
Generic and enhanced data
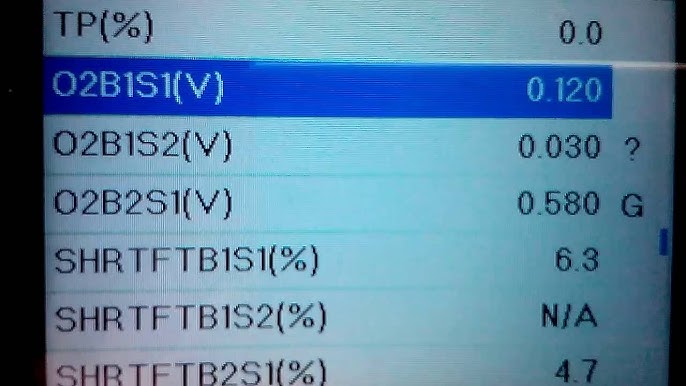
Generic emissions-related data and manufacturer-enhanced data can use different labels or definitions. Preserve the full PID name in your notes. Two similarly named values are not necessarily interchangeable, especially for commanded versus measured quantities.
Helpful display features
Graphing and recording can make trends easier to compare. They do not make the underlying reading more authoritative. Choose a small relevant set of parameters and keep their units visible rather than relying only on a red or green gauge color.
Set up a safe, documented session
Follow the tool and vehicle instructions for connection and ignition state. Keep the vehicle secure, ensure appropriate ventilation if the engine is running, and keep the lead away from pedals and moving parts.
Record the starting condition
Note whether the engine is cold, warming up or already at a stable operating condition. Include time since startup, whether accessories are running and the symptom you are investigating. Those details make a saved reading meaningful later.
Save existing codes and available freeze-frame information before clearing anything. A reset can remove useful context. Reading information is different from running an actuator command or changing an adaptation; do not select those functions casually.
Check the communication state
Make sure the displayed values are current rather than a previously saved recording. Watch timestamps or a parameter expected to change with the current operating state. A frozen screen can be a connection issue rather than a vehicle fault.
If the tool will not connect reliably, use the separate OBD2 connection troubleshooting guide. Do not interpret intermittent communication as intermittent sensor operation until the connection is established.
Use the correct vehicle profile where the tool requires one. The wrong engine or module selection can produce missing data or misleading labels even though the connector fits.
Keep the first session simple: confirm connection, save the existing diagnostic record and collect a short, clearly labeled baseline. Add complexity only when a specific question requires it.
Know which screen you are reading
Live values, freeze-frame information, readiness status and recorded playback answer different questions. Mixing them can make an old operating condition look like a present fault.
Before comparing two screenshots, check that both came from the same module and data mode. A freeze frame is a captured event, not a continuously updated view of the engine now.Live versus captured data
For each value, write the full parameter label, units and whether it represents a command, a measured response or a calculated value. This prevents a requested pressure from being mistaken for a pressure actually achieved.Choose a relevant parameter set
Select the few parameters needed to answer the question. For a fueling investigation, relevant engine state and related corrections may be more useful than unrelated temperatures from another module. The exact set depends on the diagnostic procedure.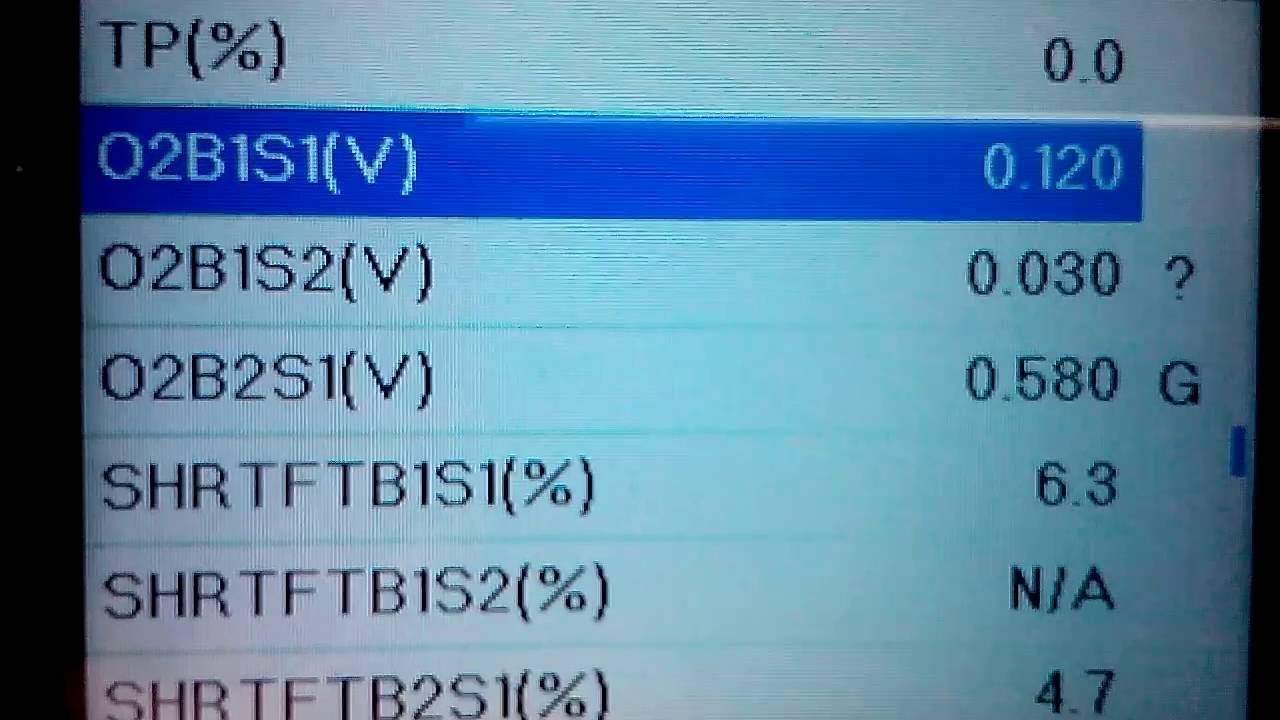
Credit: www.youtube.com
Interpret values together
The vehicle's service information supplies the expected behavior for the test. The scanner manual explains the display. Innova 3160b scanner manual provides examples of PID interpretation; its examples should not be treated as specifications for every engine.
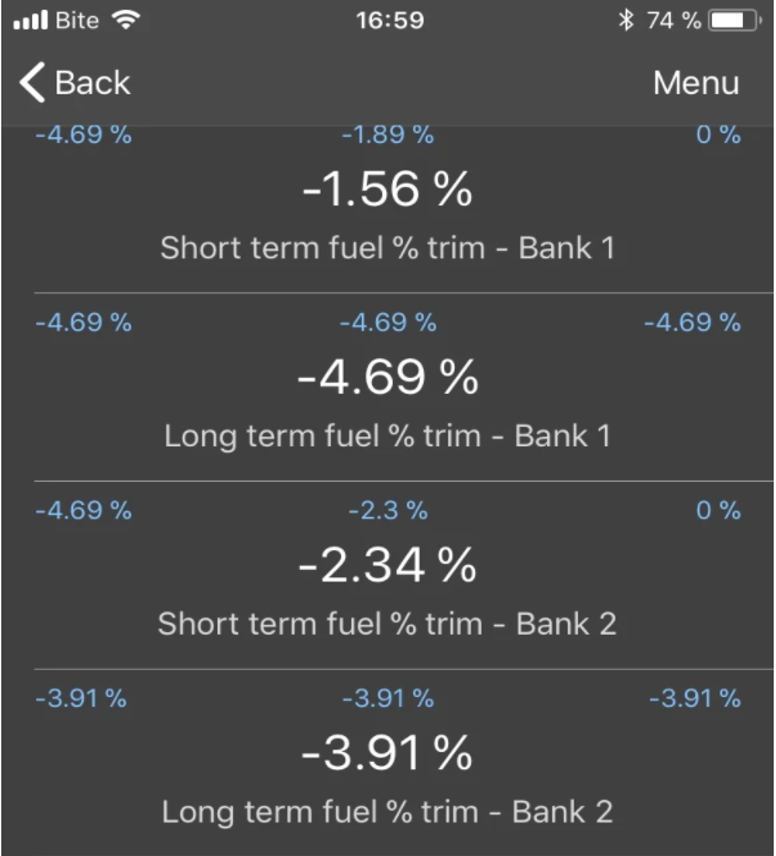
Fuel-trim direction
Fuel-trim percentages describe a correction rather than a direct measurement of injector cleanliness. Positive correction adds fuel relative to the base calculation; negative correction removes it. The cause of that correction still needs diagnosis, and a universal percentage limit cannot cover every application and state.Units and reference points
Pressure units and reference types matter. A value in kilopascals cannot be compared numerically with one in pounds per square inch, and absolute pressure differs from pressure relative to atmosphere. Record the displayed definition before comparing it with a specification.Common interpretation traps
Innova: reading fuel trim in live data discusses fuel-trim direction. Use that concept without turning a trim sign into a parts verdict: the correction can respond to several underlying conditions, not just an injector or oxygen sensor.
A parameter that is unavailable is not necessarily zero. Preserve the scanner's exact message. An unsupported PID, a disconnected tool and a genuine zero reading are different states that require different responses.Missing or unsupported values
If several values freeze together, investigate communication and playback state first. If one value is absent, check whether that vehicle and module support it. Replacing a sensor cannot add coverage that the tool does not have.Unexpected readings
Check units, the selected vehicle, engine state and the PID definition before interpreting an extreme value. If the value remains implausible, follow the relevant circuit or component test; the display alone does not locate the fault.Make comparisons reproducible
Comparing a cold start with a fully warmed engine can be useful, but label them as different conditions. Do not call a difference deterioration when the operating state has changed.
Keep a baseline record with date, vehicle identification, tool version and operating state. This helps a technician interpret a later log without having to reconstruct what the first screenshot meant.Software settings versus sensor calibration
Updating the scan tool may correct coverage or display issues. It does not recalibrate the vehicle's sensors. Do not perform adaptation resets or calibration routines merely because a live-data number looks unfamiliar.Safe recording conditions
Never read or operate the screen while driving. If road-condition logging is required, use an appropriately secured recording setup and a qualified person or workshop procedure. Do not create an unsafe driving condition to provoke a fault.Turn the recording into a testable question
A useful log should show what happened just before, during and after the complaint. Keep the event short enough to review and label the moment the symptom occurred.
Graph interpretation
Check the graph's time axis and scale before comparing traces. An automatically rescaled graph can make a small change look dramatic. A visually flat trace may also conceal changes if its scale is too broad.
A delay between displayed parameters can affect the apparent sequence. Do not infer exact millisecond causation from a slowly refreshed general-purpose scan display.
A practical log note
Record: the complaint, operating condition, selected PIDs, units, event time and the relevant specification or expected behavior. Keep the original file when the tool can export it, rather than only a cropped image of one gauge.
For example, a note that a hesitation occurred while a particular command and response diverged gives the workshop a question to investigate. It does not prove which component caused the divergence.
If the issue is an incomplete emissions monitor rather than a changing measurement, see what INC means on an OBD2 scanner. Readiness is a separate status from live performance data.
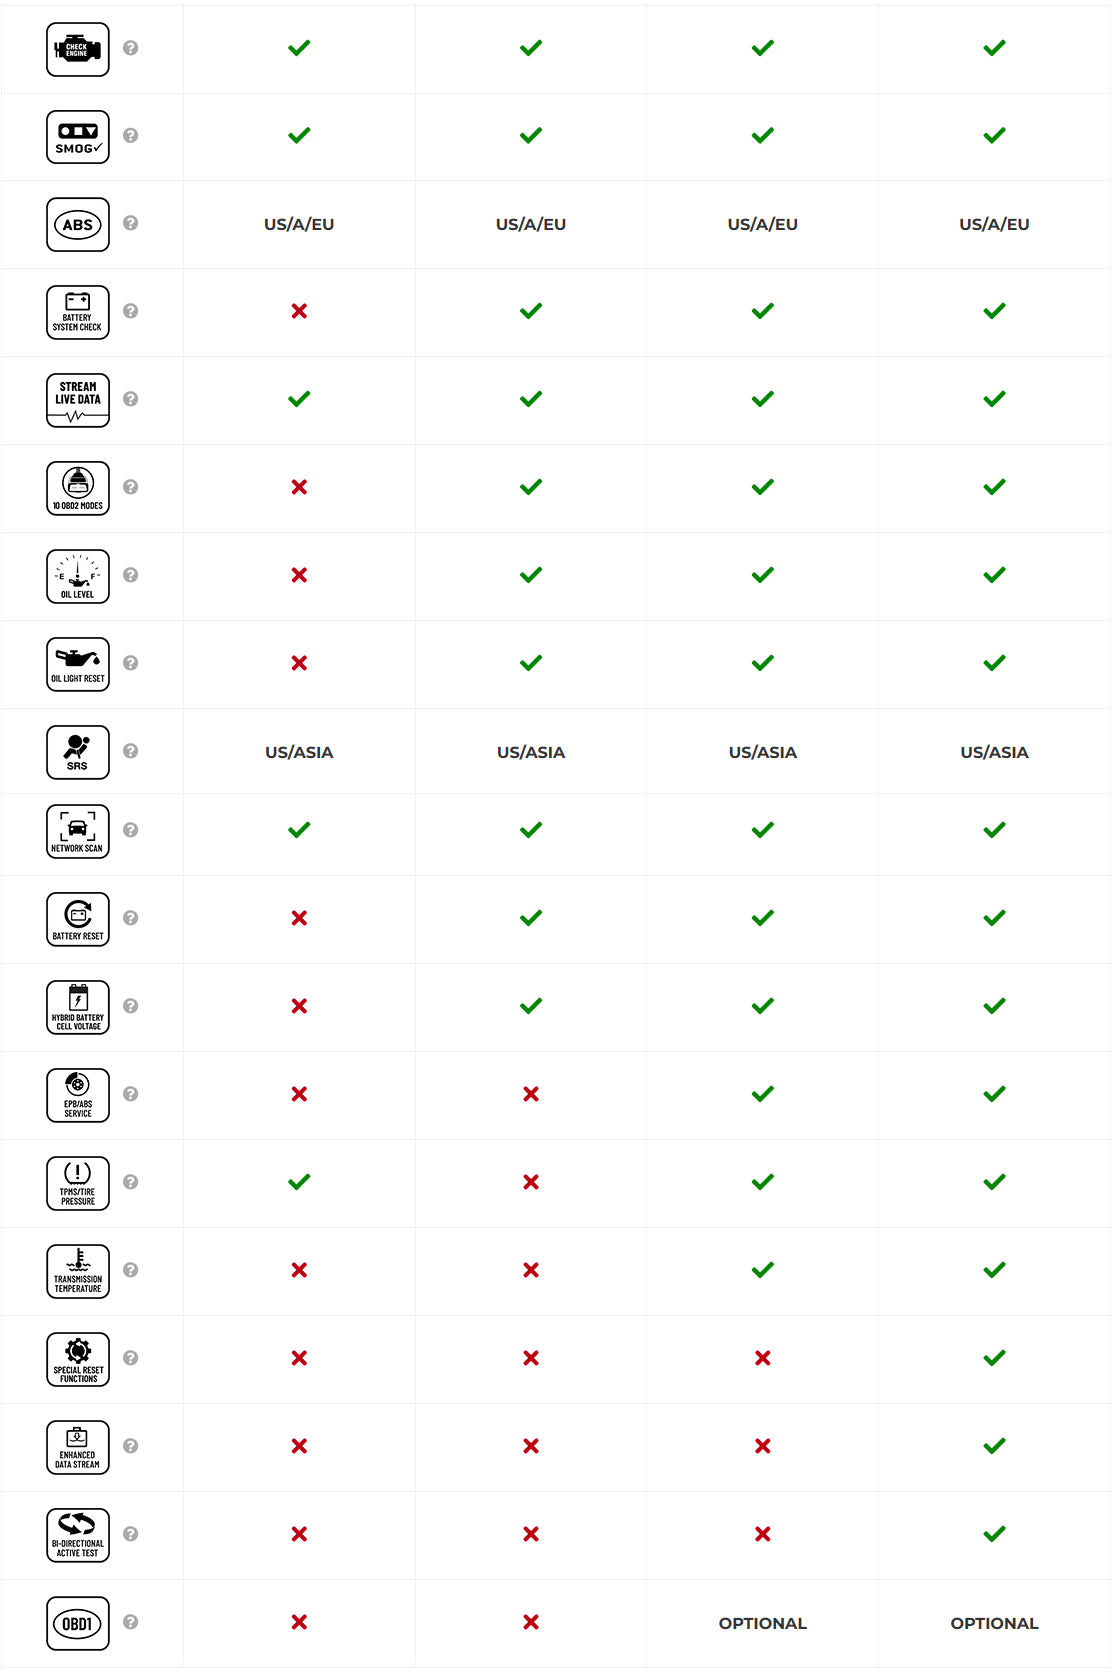
Credit: www.innova.com
When the data is useful enough to act on
Act when a repeatable observation has been checked against the correct definition and procedure. The next action may be an electrical, mechanical or pressure test rather than a parts order.
If no applicable specification is available, keep that limitation explicit. A forum screenshot from another engine is not a reliable substitute for the vehicle's diagnostic information.
The strongest reading is one you can explain: what was measured, under which conditions, what was expected and what remains unproven.


Automotive reference information. Confirm specifications in the manual for your exact vehicle. Original replacement guides link to their research sources. About us